DATA-150---Jtao
Assignment 3
Jialu Tao
Word Count(without references): ~ 1300
Introduction
Project-induced displacement and resettlement are some of the serious effects of the construction of infrastructures. Large-scale development of infrastructure projects typically requires land, and sometimes very large tracts of land. This need for land can result in the dislocation of the people living there (Frank, 2017). Even in situations where people are not required to physically move, the project may still impact their livelihoods or income-generating activities (IFC 2002), or cause other environmental and social impacts that make continuing to live there untenable. Project-induced resettlement can occur on a massive scale, for example, there were nearly 1.13 million people had to be relocated to the Three Gorges Dam in China. Two models, decision tree classifier and estimation of land production potential, are discussed in this passage to help us to understand how Three Gorges Dam (TGD) affected cropland change in the three gorges reservoir area and how it related to the project-induced displacement.
Firgure 1
Location map of the Three Gorges Reservoir area
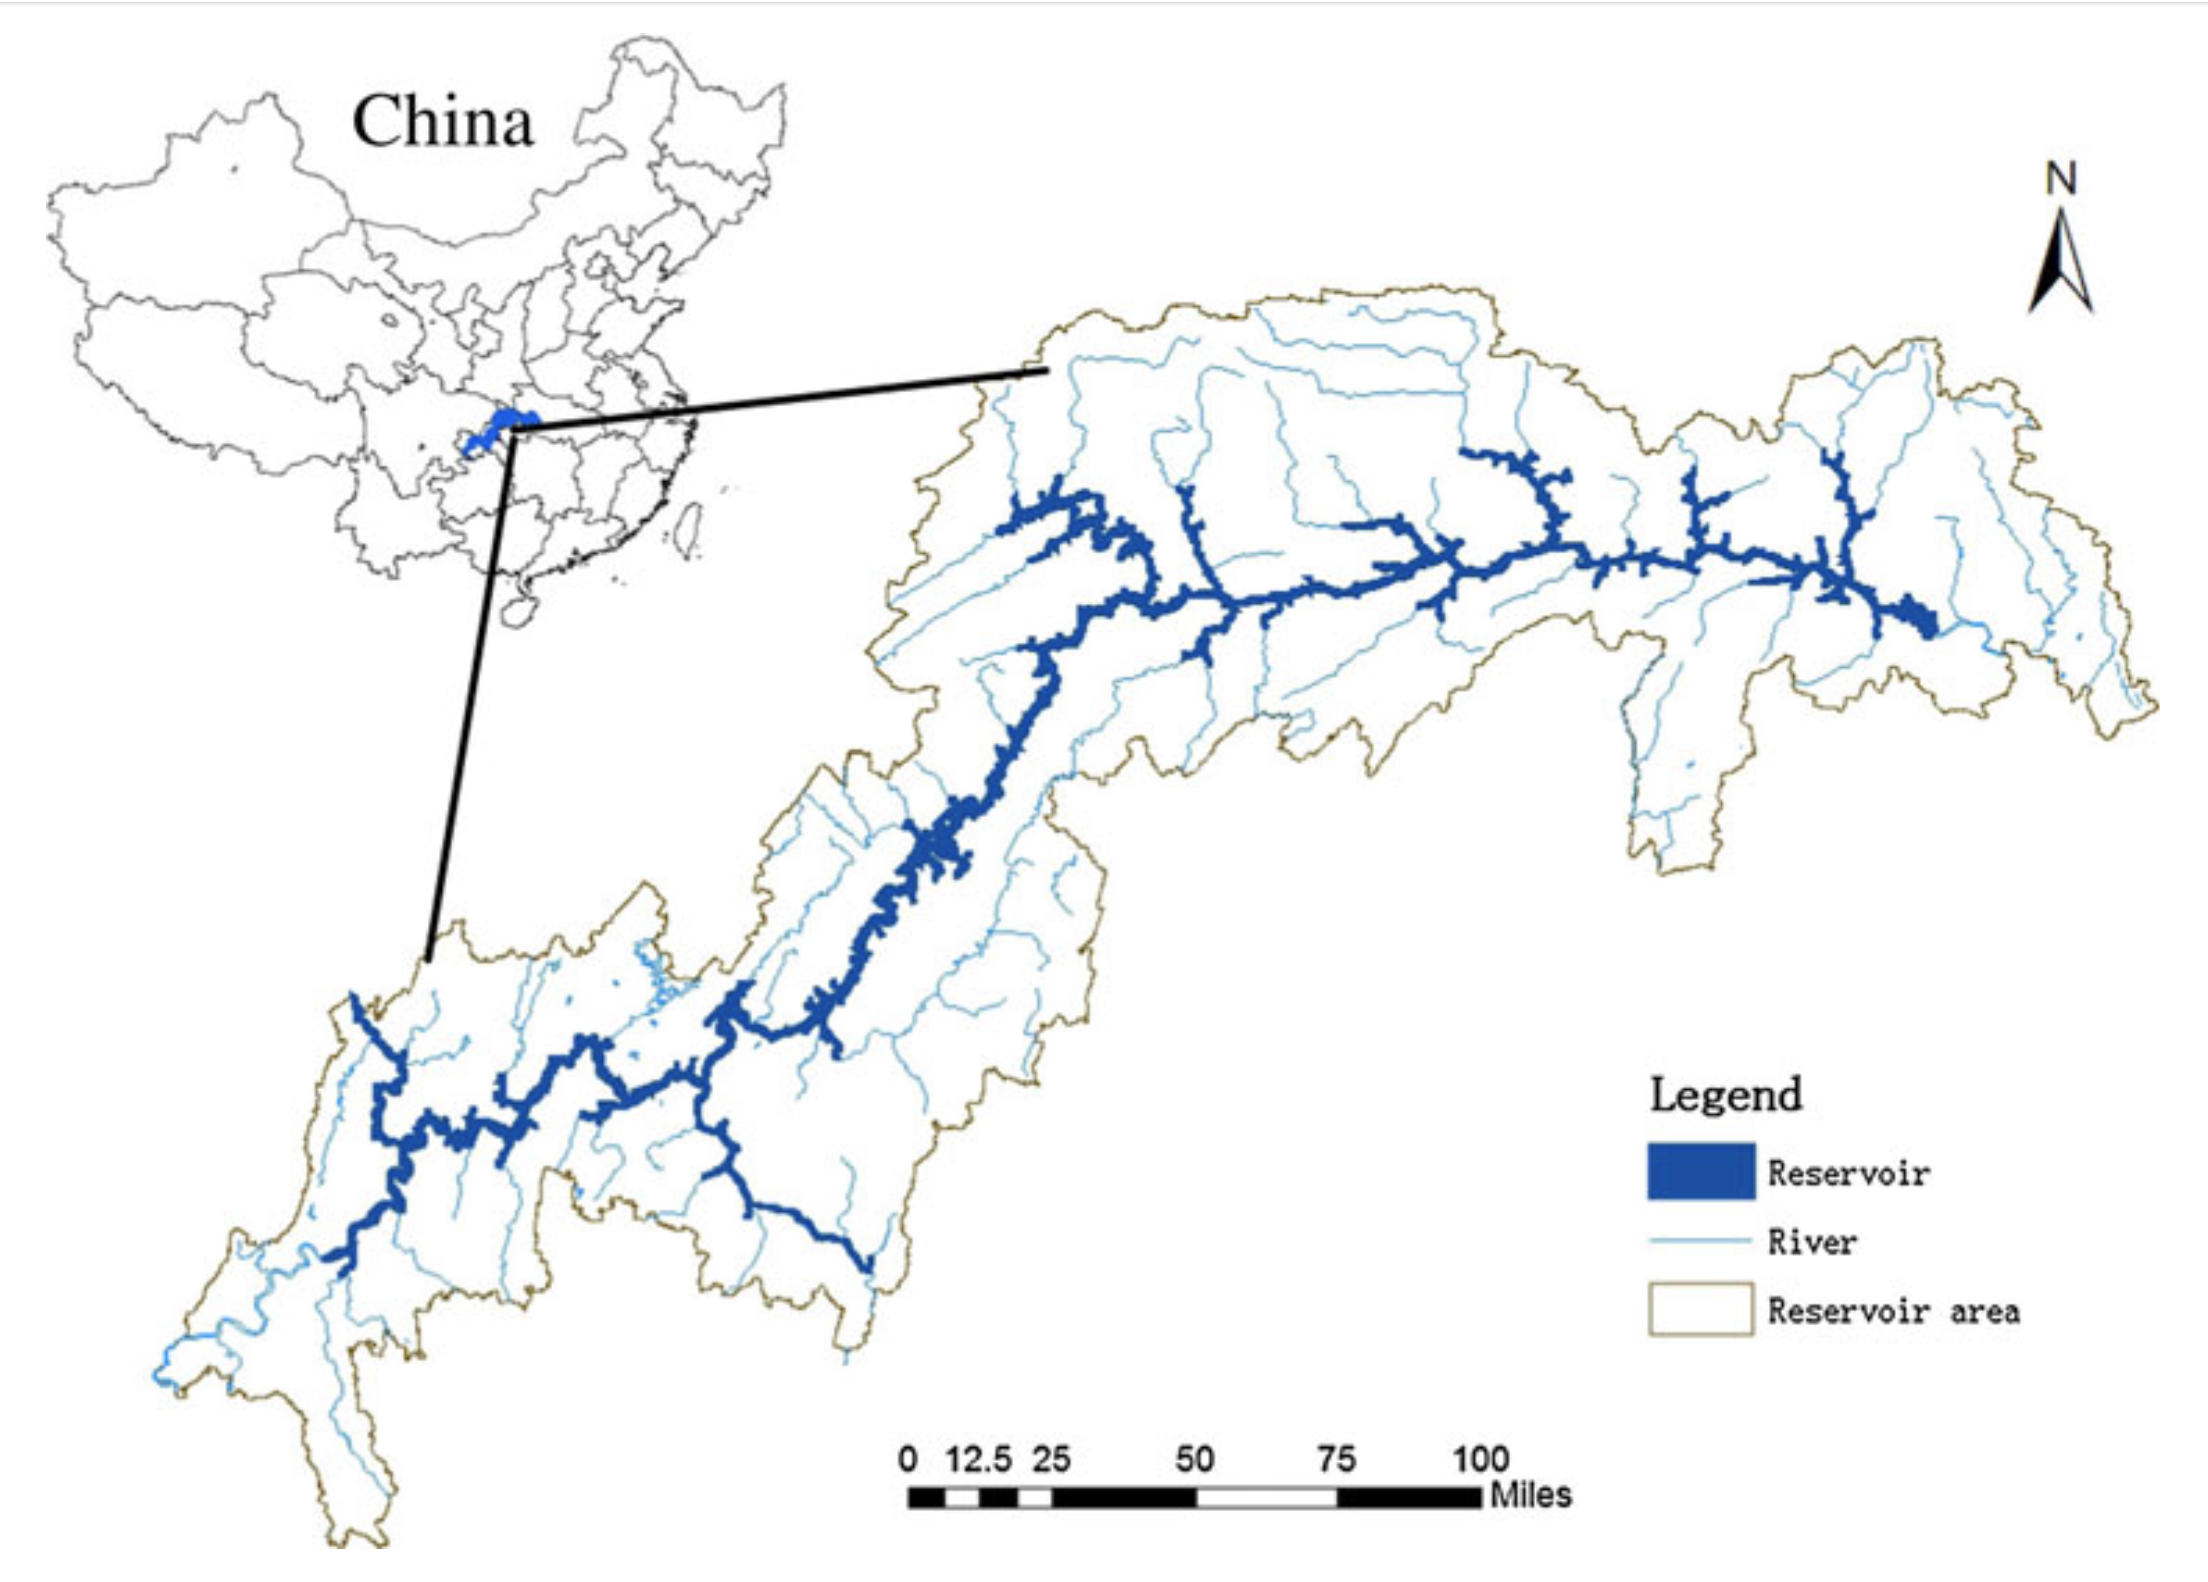 source: Zhange et al., 2012
Data Sources
Remote sensing is widely used in Land use and Land cover change project. For cropland mapping at a scale of 1: 50,000 in Three Gorges Area (TGRA), the study acquired Landsat/ CBERS images, with a resolution of 30 m for 1992, 2002, SPOT multi/pan images with 10m resolution for 2002, and SPOT5/ALOS multiple spectral images with 10m resolution for 2007 (Zhang et al., 2012). High-quality, multi-spectral imageries provided by these sensors are not just pictures but contain many layers of data collected at different points along the visible and invisible light spectrum which can reveal what types of vegetation are present. Also, due to the limited revisit period and a swath width of high-spatial-resolution satellite sensors and other effects, such as cloud coverage, it is often beneficial to apply various viable spatial resolution images from the different sensors (Liu et al., 2018). The data selection in 1992 1992, 2002, and 2007 was corresponded to the stage before the construction of TGP, before the inundation of the reservoir to the 135m high water level, and before completion of TGP with a water level of 175m, respectively (Zhang et al., 2012). In addition, to improve the accuracy of the cropland identification and mapping, DEM (digital elevation model) and slope gradient data with a resolution of 10 m, an old land use map at a scale of 1: 100,000, crop phenology calendar, and social economic census data of TGRA were referenced (Zhang et al., 2012). DEM are essential for doing radiometric and geometric corrections for terrains on the remotely sensed imageries (Gandhi et al., 2016).
Decision Tree Classifier
Decision Tree (DT) uses a multi-stage or sequential approach to the problem of label assignment (Pal & Mather, 2003). The intuition behind the decision tree is simple yet also powerful. It will recursively do the following until no more nodes can be split: choose the best possible test at the current node according to some good measure and split the current node using that test (Breiman et al., 1984). In other words, for each attribute in the dataset, the decision tree algorithm forms a node, where the most important attribute is placed at the root node. For evaluation, we start at the root node and work our way down the tree by following the corresponding node that meets our condition or “decision”. This process continues until a leaf node is reached, which contains the prediction or the outcome of the decision tree (Robinson). The advantages that decision trees offer include an ability to handle data measured on different scales, lack of any assumptions concerning the frequency distributions of the data in each of the classes, flexibility, and ability to handle non-linear relationships between features and classes (Friedl & Brodley, 1997). Also, the analyst can interpret a decision. It is not a ‘black box’ the hidden workings of which are concealed from view (Pal & Mather, 2003).
Figure 2
Framework of decision tree algorithm for cropland classification
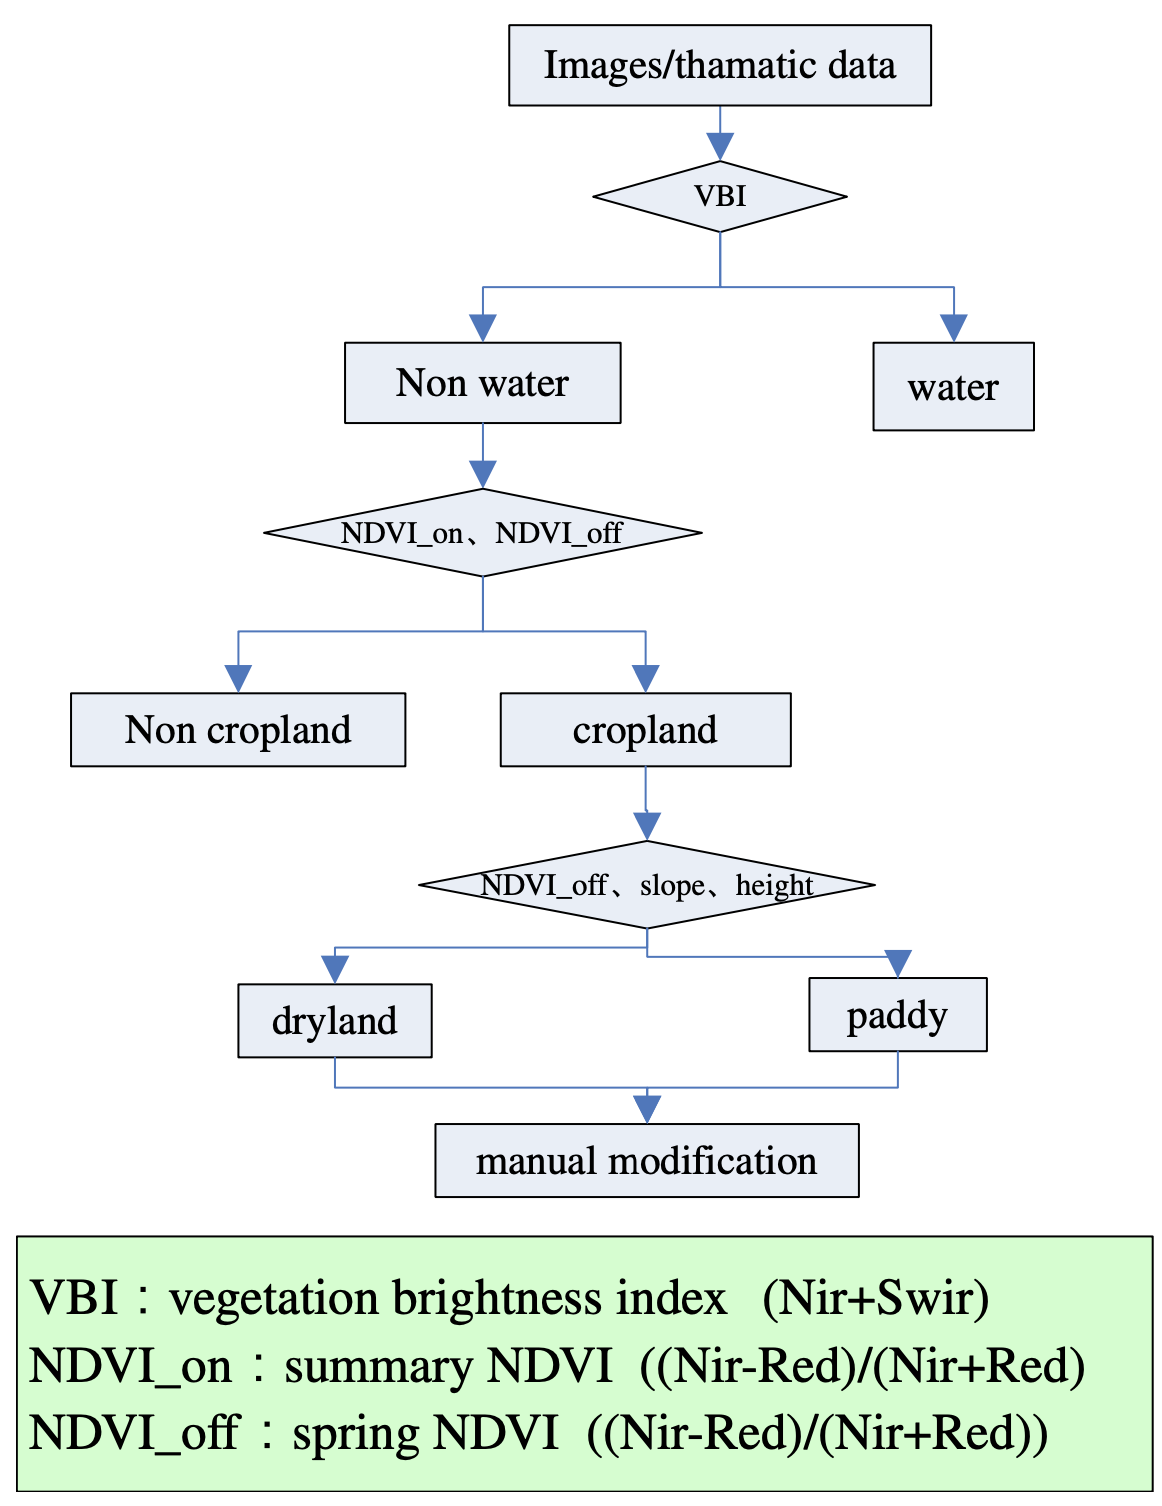 source: Zhange et al., 2012
The index of VBI, NDVI_on, NDVI_off, slope, and elevation were meaningful to the identification of cropland (Fig. 2). The primary idea of cropland retrieval was cropland identification from natural vegetation and bare areas(Zhang et al., 2012). NDVI is a vegetation index that is associated with vegetation density. It is often used to distinguish vegetation from non-vegetation features which normalize the difference between the green leaf scattering in the near-infrared to the chlorophyll absorption. In the TGRA, cultivated land is divided into dry cropland and paddy fields (Wang et al., 2020). The cropland had declined drastically from 1992 to 2007 (Table 1), with a total decrease of 59,600 hectares, accounting for 4.0% of the total area of cropland. The loss in dryland is way larger than paddy fields. This is because compared with paddy fields, soil erosion is more likely on dry cropland. After all, conservation efforts typically lack engineering measures (Wang et al., 2020). Changes in cultivated land from 1992 to 2007 typically occurred along the Yangtze River and its tributaries in TGRA, which was the region with high population density (Fig. 3).
Table 1
Cropland change over the 15-year span in TRGA(ha)
 source: Zhange et al., 2012
Figure 3
Cropland change map in TGRA from 1992 to 2007
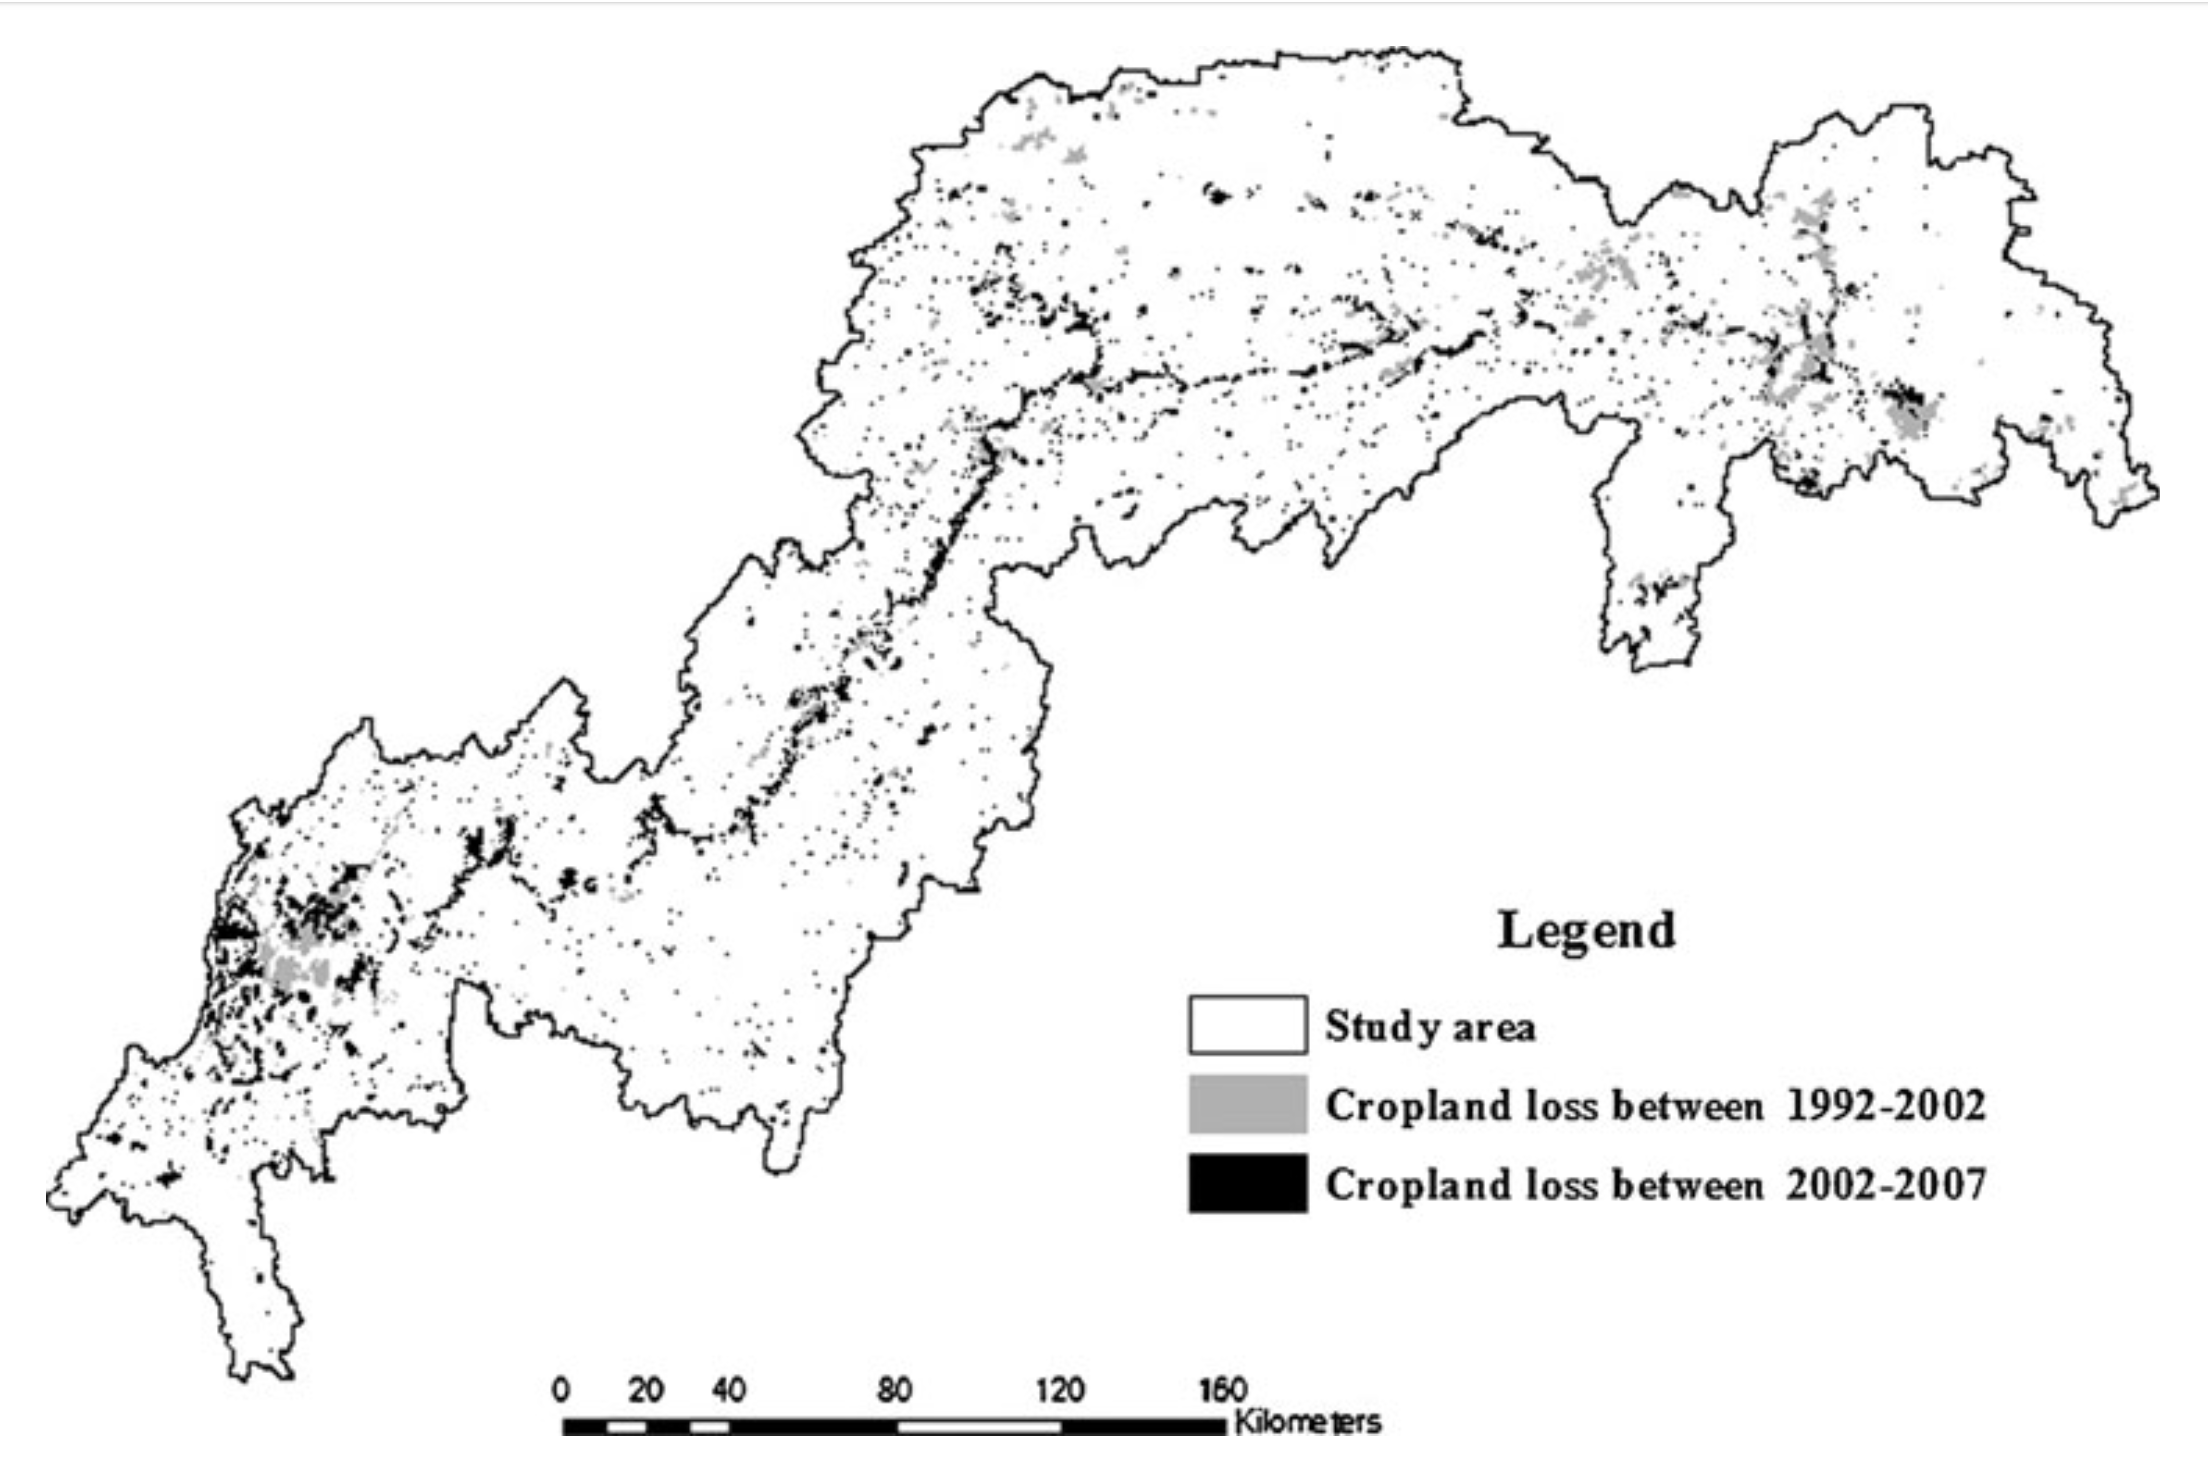 source: Zhange et al., 2012
Land Potential Productivity
Land production potential (LPP) estimation is based on the conversion of plant energy and heat. The LPP is employed in the assessment of food production capacity. It represents maximum food production potential under natural conditions. LPP: Land production potential, kg/ha; C: dry material heat the chemical burning the energy of 1g dry matter, the majority of crops average C is 4.25 kcal/g; F: utilization efficiency of sunlight energy; Q: annual solar radiation, kcal/cm^2; n: frost-free days through 1 year; f(w): ratio of precipitation to evaporation; r: annual precipitation, mm; E0: annual evaporation, mm; S1: assigned score of cropland slope; O: assigned score of soil organic matter content; Si: assigned score of soil granule; a, b, c: weight value of soil conditions (Zhang et al., 2012). The algorithm is as follow, with the normalized score of soil conditions of S1, O, Si being assigned equally according to their content (Table 2)


Table 2
Score assignation for soil factor evaluation
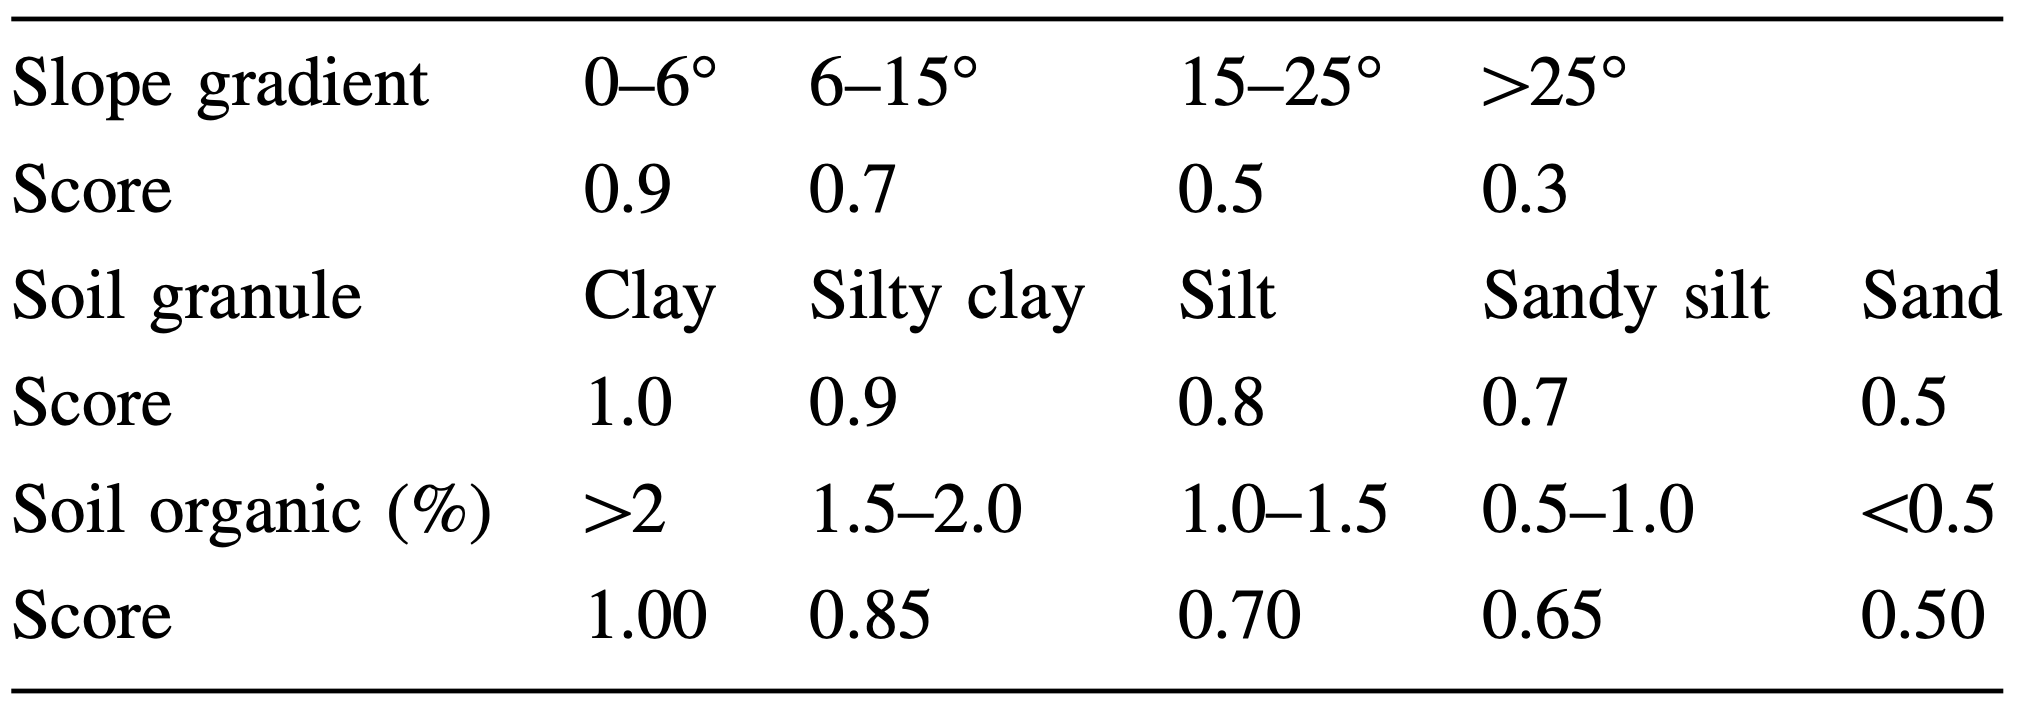 source: Zhange et al., 2012
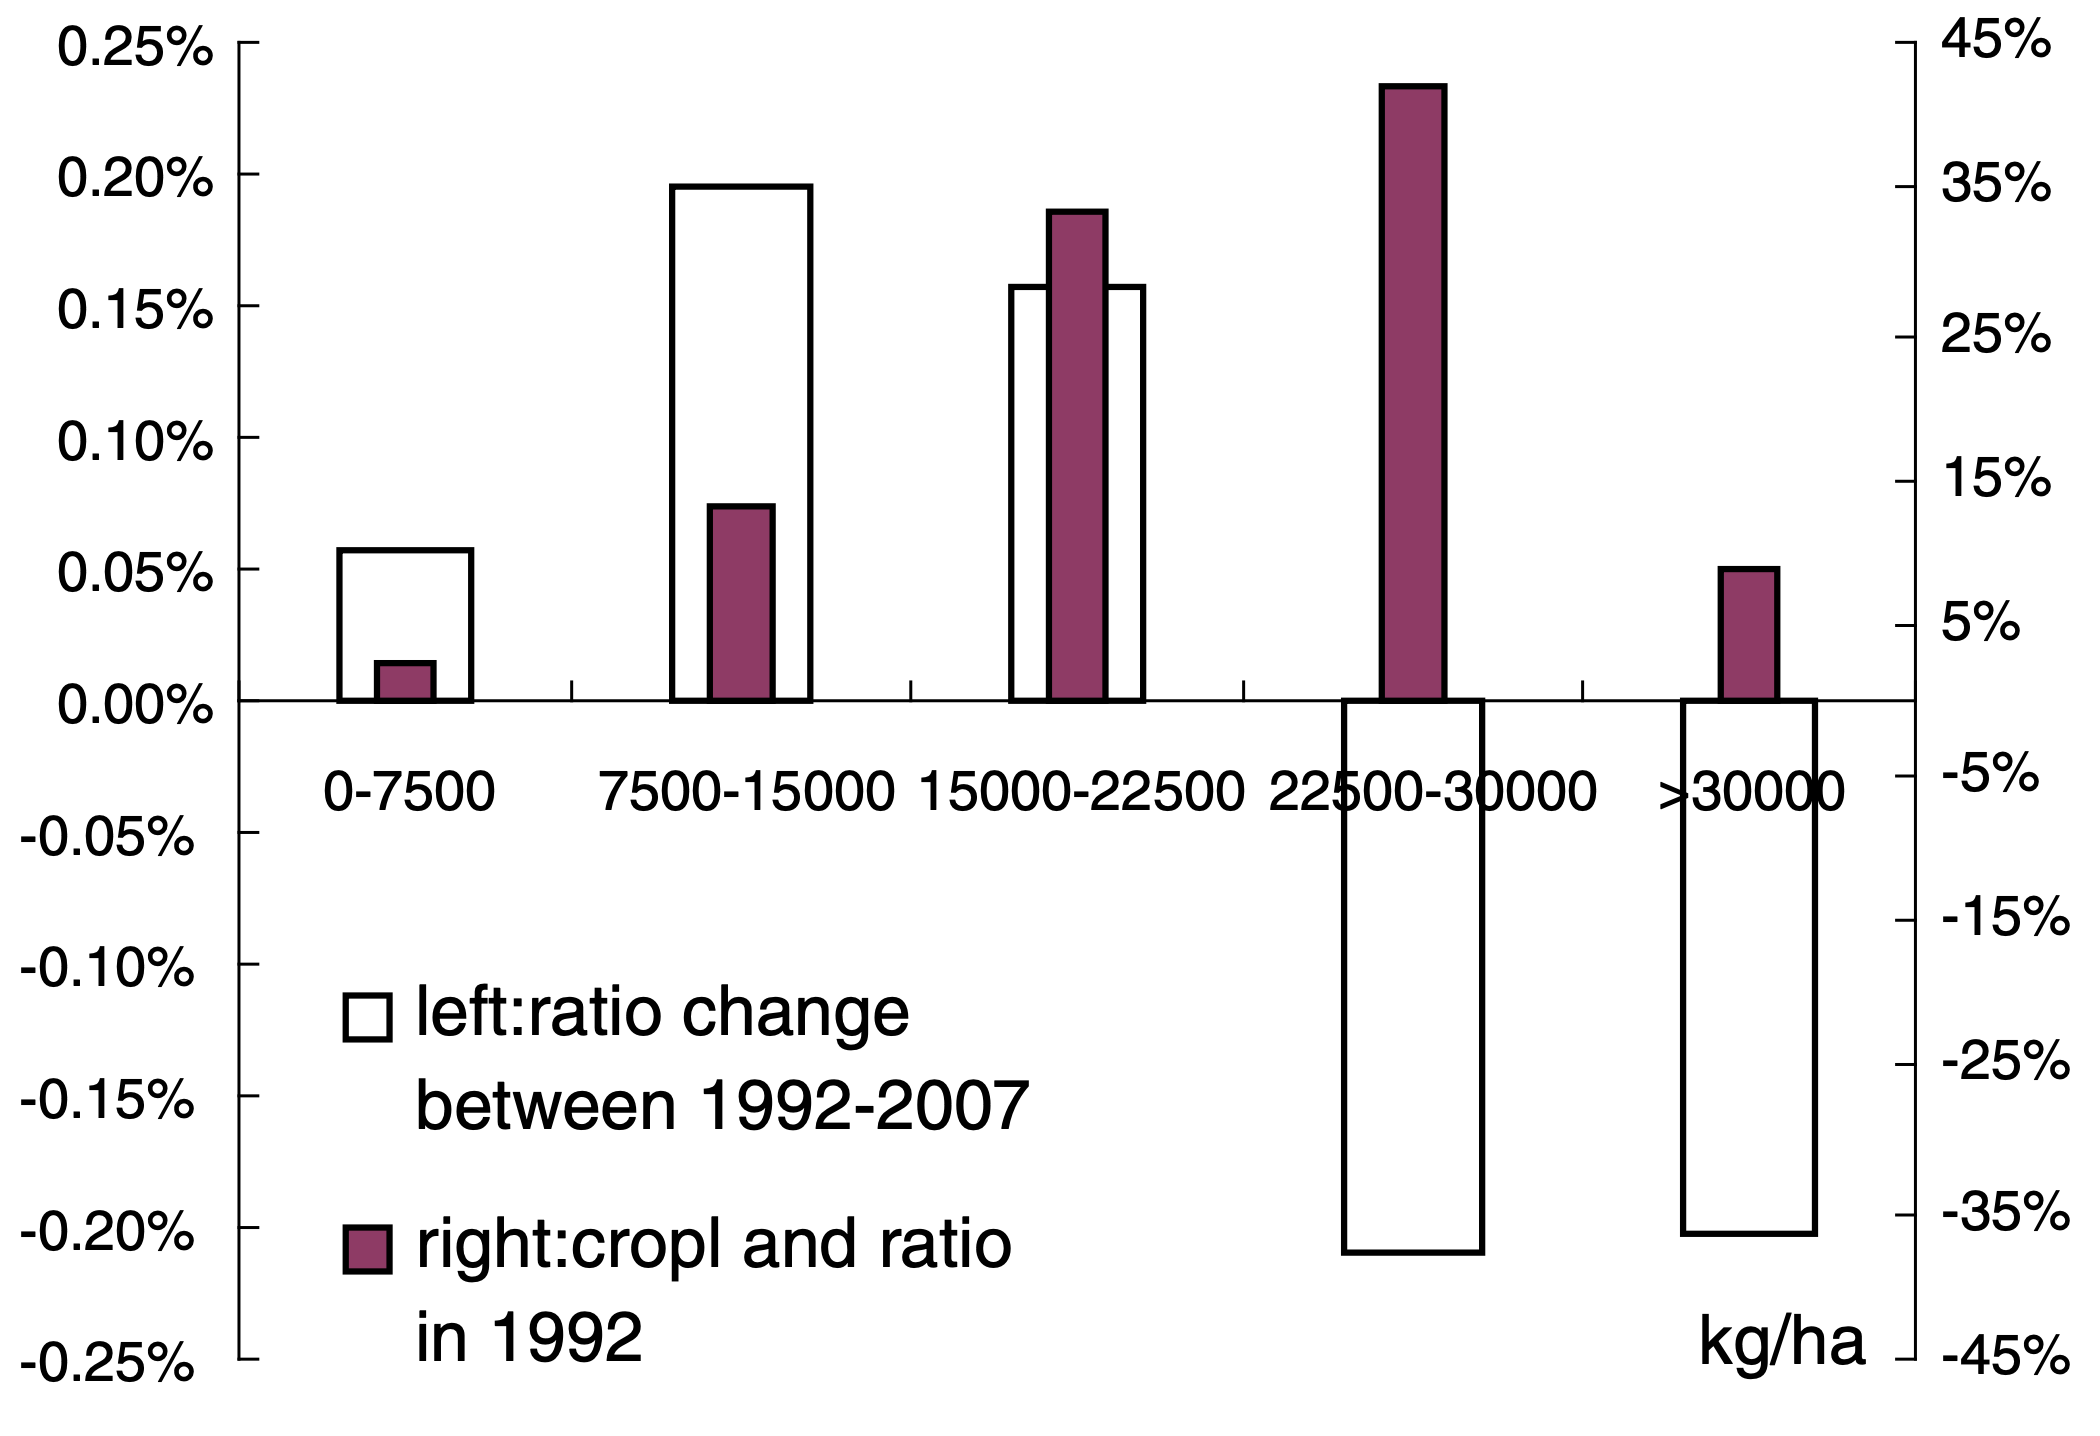
The quality of cultivated land determined grain productivity. The decrease in cropland area and changes in its spatial distribution caused land quality changes (Zhang et al., 2012). There are five degrees of cropland production potential from a low of 0-7,500 kg/ha to a high of more than 30,000 kg/ha. The loss of high-quality cropland is larger than the low-quality cropland because of the urban construction, expansion of natural vegetation cover, and dam projects, especially, TGP. TGP construction led to immediate consequences of cropland loss by reservoir inundation and indirect cropland occupation of resident resettlement (Zhang et al., 2012).
Figure 4
Cropland production potential change from 1992 to 2007
 source: Zhange et al., 2012
Conclusion
These two models, decision tree classifiers and the assessment of land production potential are used in a post-assessment. Based on the study conducted by Zhang et al (2012), much-fertilized cropland and cities submerged located around Yangtze River in low reach in TGRA which led to the immediate cropland loss. One of the plans of project-induced resettlement is settling in nearby areas which were most preferred by TGP project planners considering the resettlement funding, human capital, and social stability. However, in the study and in-depth interviews delivered by Li & Philip (2000), residents are facing severe difficulties in maintaining livelihoods after they moved because of the limited arable cropland. The actual residents who were resettled in nearby areas were worse off because of the project-induced resettlement. However, the same models are also reasonable to be applied to the assessment before the whole project predicts the trend of land potential productivity, which may lead to a well-rounded and efficient plan.
Reference
Breiman, L. (1984). Classification and regression trees. Chapman & Hall/CRC.
Friedl, M. A., & Brodley, C. E. (1997). Decision tree classification of land cover from remotely sensed data. Remote Sensing of Environment, 61(3), 399–409. https://doi.org/10.1016/s0034-4257(97)00049-7
Gandhi, S. M., & Sarkar, B. C. (2016). In Essentials of mineral exploration and evaluation (pp. 53–79). essay, Elsevier.
Heming, L., & Rees, P. (2000). Population displacement in the Three Gorges reservoir area of the Yangtze River, central China: relocation policies and migrant views. International Journal of Population Geography, 6(6), 439–462. https://doi.org/10.1002/1099-1220(200011/12)6:6<439::aid-ijpg198>3.0.co;2-l
IFC. 2002. Handbook for preparing a resettlement action plan [Internet]. Washington (DC): International Finance Corporation.
Lei, Z., Bingfang, W., Liang, Z., & Peng, W. (2012). Patterns and driving forces of cropland changes in the Three Gorges Area, China. Regional Environmental Change, 12(4), 765–776. https://doi.org/10.1007/s10113-012-0291-8
Liu, Q., Huang, C., Liu, G., & Yu, B. (2018). Comparison of CBERS-04, GF-1, and GF-2 Satellite Panchromatic Images for Mapping Quasi-Circular Vegetation Patches in the Yellow River Delta, China. Sensors, 18(8), 2733. https://doi.org/10.3390/s18082733
Pal, M., & Mather, P. M. (2003). An assessment of the effectiveness of decision tree methods for land cover classification. Remote Sensing of Environment, 86(4), 554–565. https://doi.org/10.1016/s0034-4257(03)00132-9
Robinson, S. (n.d.). Decision Trees in Python with Scikit-Learn. Stack Abuse. https://stackabuse.com/decision-trees-in-python-with-scikit-learn/.
Vanclay, F. (2017). Project-induced displacement and resettlement: from impoverishment risks to an opportunity for development? Impact Assessment and Project Appraisal, 35(1), 3–21. https://doi.org/10.1080/14615517.2017.1278671
Wang, M.-feng, Tian, F.-xia, He, X.-bin, Anjum, R., Bao, Y.-hai, & Collins, A. L. (2020). Dry cropland changes in China’s Three Gorges Reservoir Region during the period 1990 to 2015. Journal of Mountain Science, 17(3), 516–527. https://doi.org/10.1007/s11629-019-5598-1